Neural Connectivity and Synchronization Software Application
Evaluation, Visualization and Prediction of neural connectivity and synchronization patterns in functional brain regions.
Input:
Lorem ipsum dolor sit amet, consectetur adipiscing elit. Suspendisse varius enim in eros elementum tristique. Duis cursus, mi quis viverra ornare, eros dolor interdum nulla, ut commodo diam libero vitae erat. Aenean faucibus nibh et justo cursus id rutrum lorem imperdiet. Nunc ut sem vitae risus tristique posuere.
Algorithm:
Lorem ipsum dolor sit amet, consectetur adipiscing elit. Suspendisse varius enim in eros elementum tristique. Duis cursus, mi quis viverra ornare, eros dolor interdum nulla, ut commodo diam libero vitae erat. Aenean faucibus nibh et justo cursus id rutrum lorem imperdiet. Nunc ut sem vitae risus tristique posuere.
Output:
Lorem ipsum dolor sit amet, consectetur adipiscing elit. Suspendisse varius enim in eros elementum tristique. Duis cursus, mi quis viverra ornare, eros dolor interdum nulla, ut commodo diam libero vitae erat. Aenean faucibus nibh et justo cursus id rutrum lorem imperdiet. Nunc ut sem vitae risus tristique posuere.
Problem Definition
Correlation and Measurement studies
Problem Definition: Physicians would rather spend valuable time evaluating the patient`s behavioral symptoms rather than examining EEG waveforms in order to extract diagnostic information. This App is built to evaluate, visualize & predict neural connectivity and synchronization patterns for patients with neurological disorder. High resolution techniques involving EEG`s usually used to examine neurocognitive, perceptional, linguistic, emotional & motor processes was adapted. Study elements include hypothesis question: Is there some disruption in neural synchronization pattern present in brain regions of patients with neurological disorder? What does the disordered pattern look like? Classification of patients based on extracted observed pattern in combination with other behavioral factors will help physicians make an objective diagnostic decision.
Inputs: 12 channel EEG signal from 105 normal individuals and 80 individuals with Autism Spectrum Disorder (ASD). 250hz sampled measurements was obtained from EGI equipment with 19 sensors located at the different regions of the brain. (Frontal-F, Parietal/polar-P, Frontal pole-Fp, Temporal-T, Occipital-O) with a 10-20 channel montage scheme, time series data set.
Algorithm
Algorithm: EEG artifact filter, time frequency decomposition, spectral analysis, Fast Fourier Transform, Butterworth bandpass filtering, Phase coupling over distance, classification algorithm, Python 3d Viewer, ,PyQt5, PyQtgraph, blender. The software development process combines iterative lifecycle and risk-driven development into a cohesive, and well documented description. Standardized architecture development methods and techniques have been adopted in developing the system. The Unified Modeling Language is usually recommended when modeling software applications. The UML provides a framework that describes architectural artifacts consisting of an integrated set of diagrams, developed to help system and software developers specify, visualize, construct, and document the artifacts of software systems, as well as for business modeling and other non-software systems. The UML represents a collection of best engineering practices that have proven successful in the modeling of large and complex systems.
Four phases of the Unified process include
Inception
Elaboration
Construction
Transition
The inception phase took the problem statement as defined above from a client as input. It traces the answers to a set of generic questions to generate a report that informs the viability or feasibilty of the software.
The elaboration phase takes the report generated by the inception phase input to perform its processing.
Three most common elaboration processes include
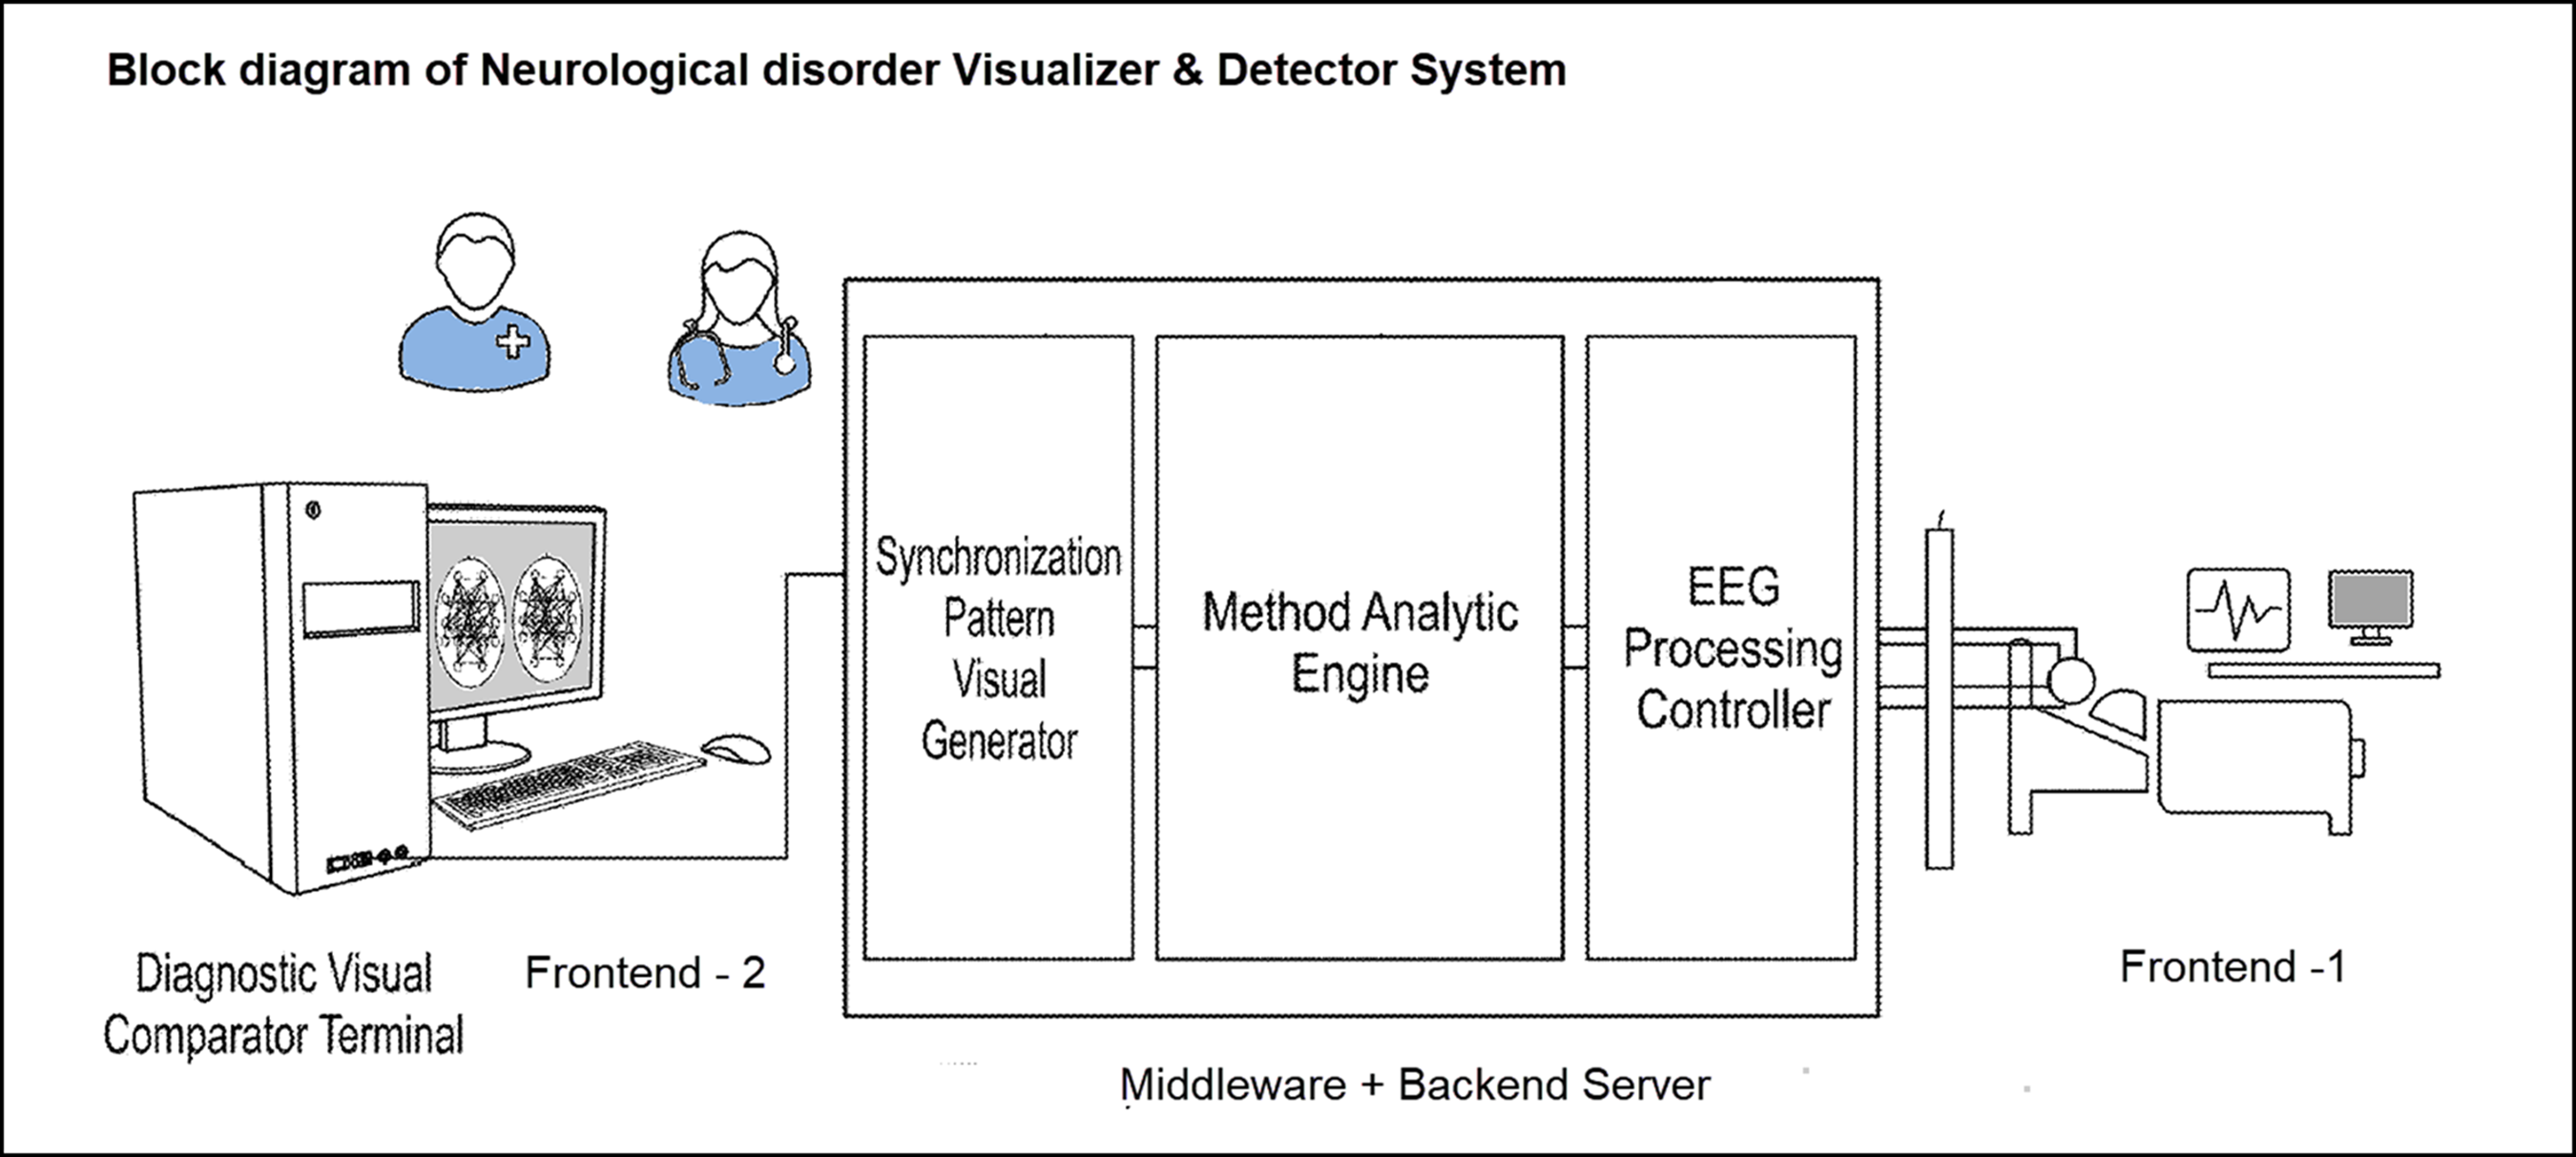
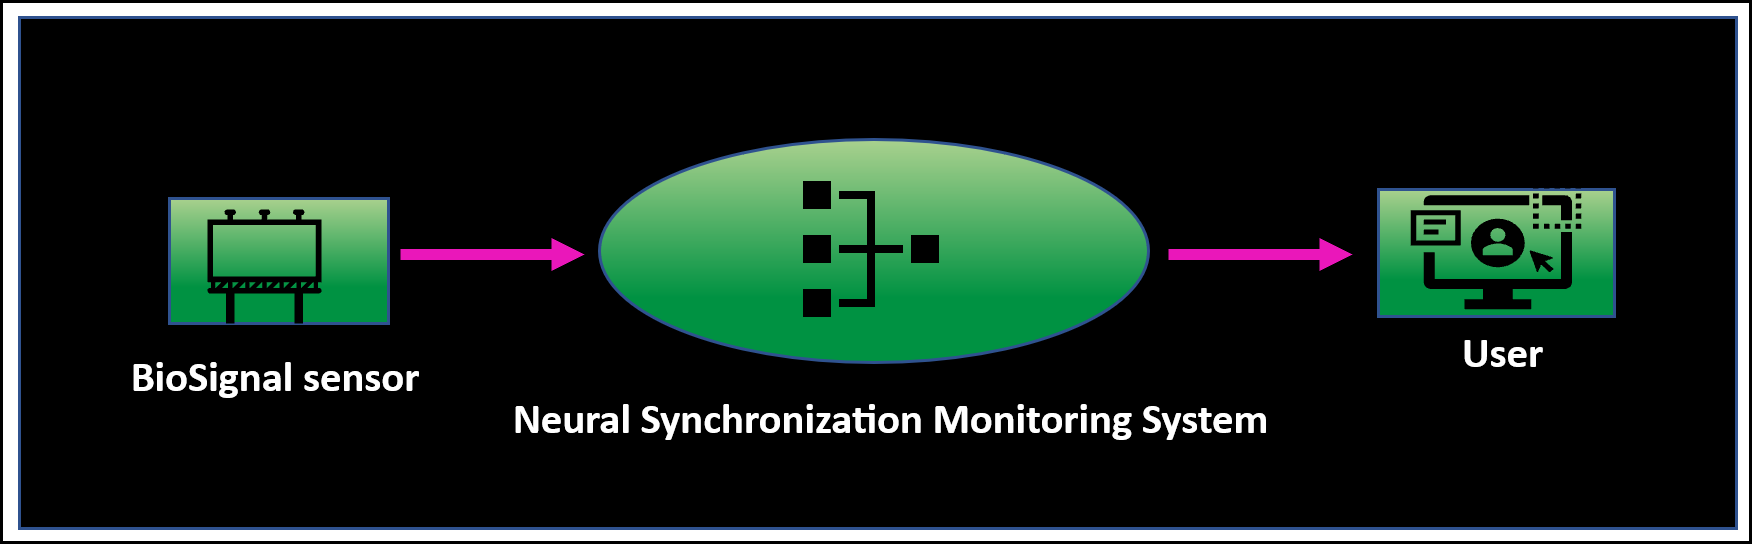
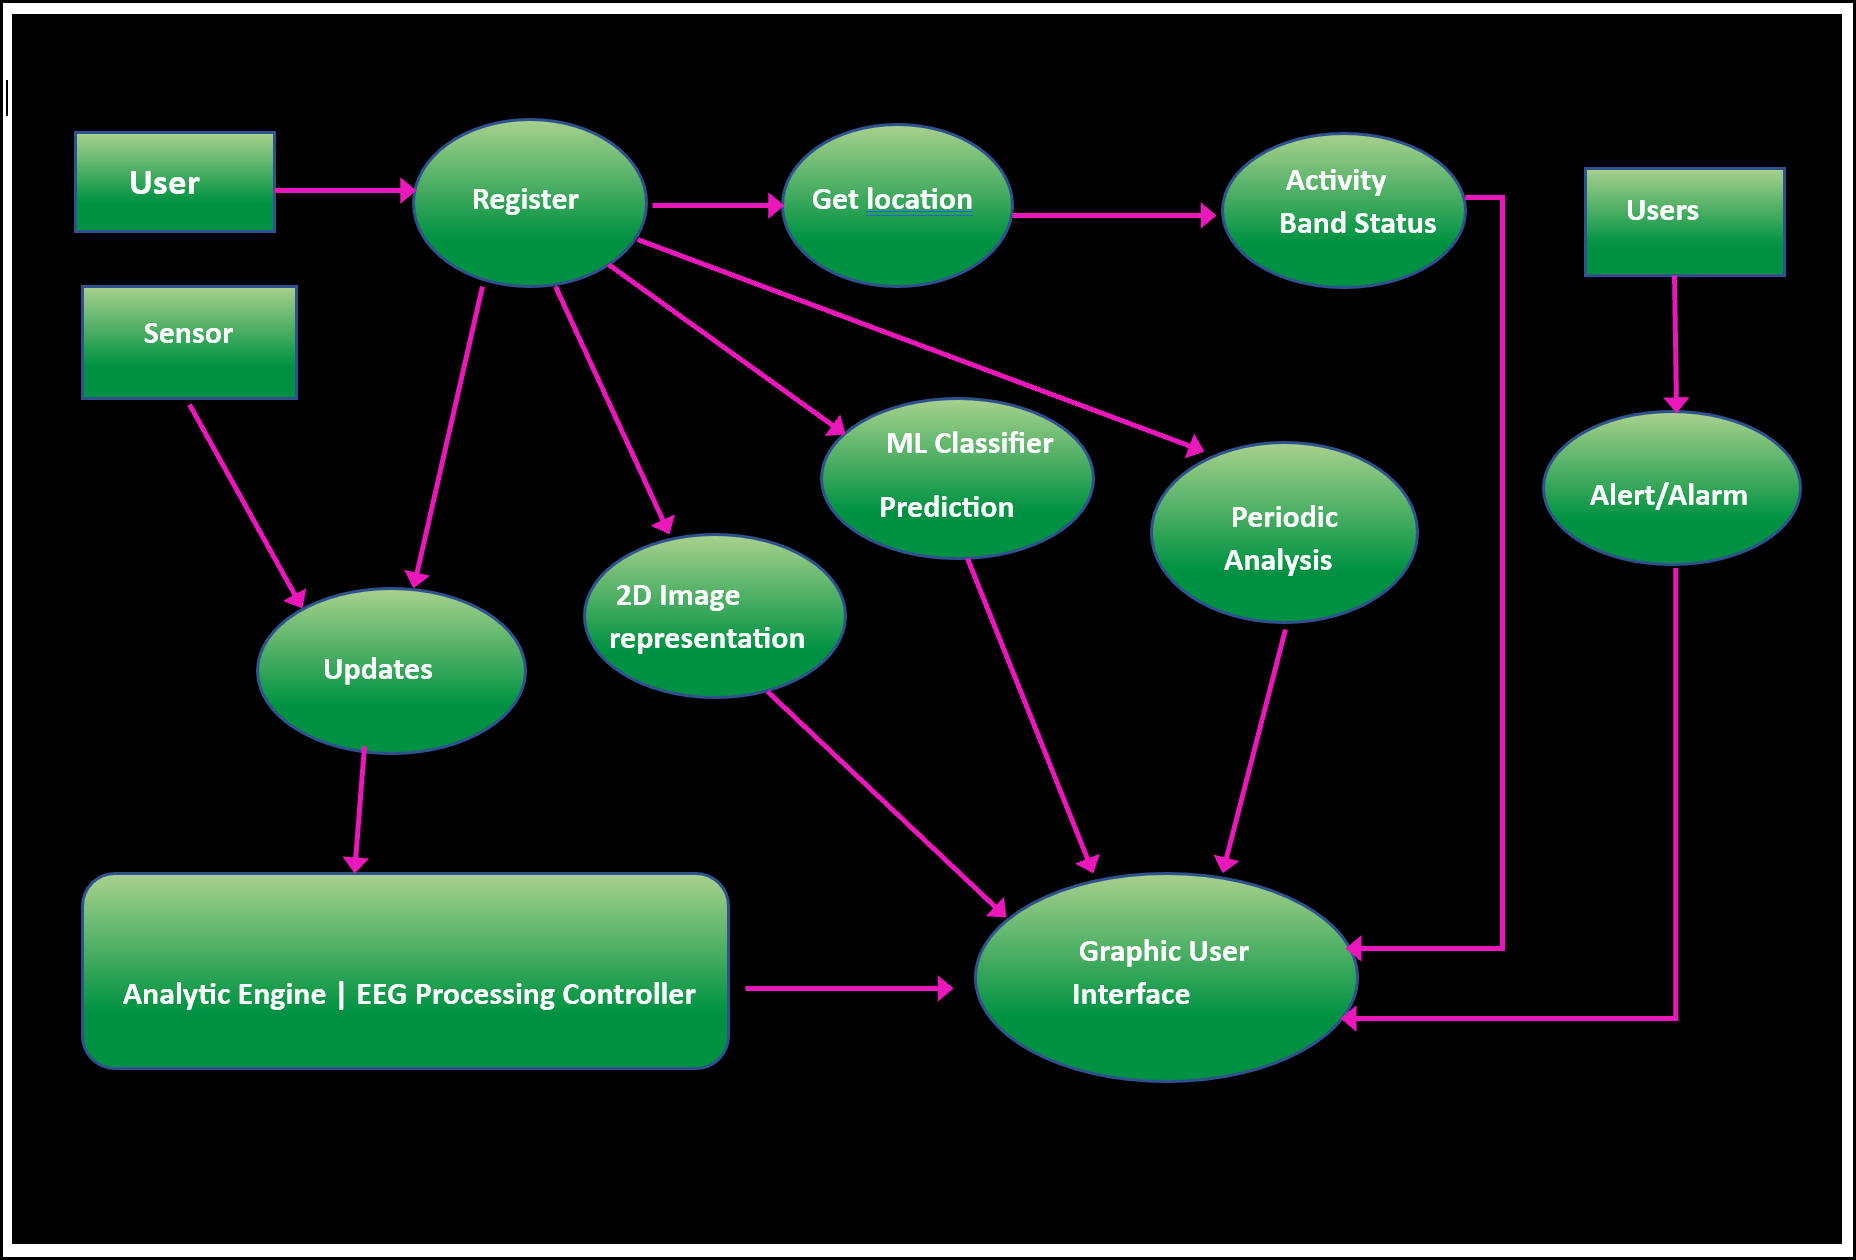
Developing a core architecture, and data flow diagrams for a given system. (see fig 1, fig 2 , fig 3)
Developing a project schedule
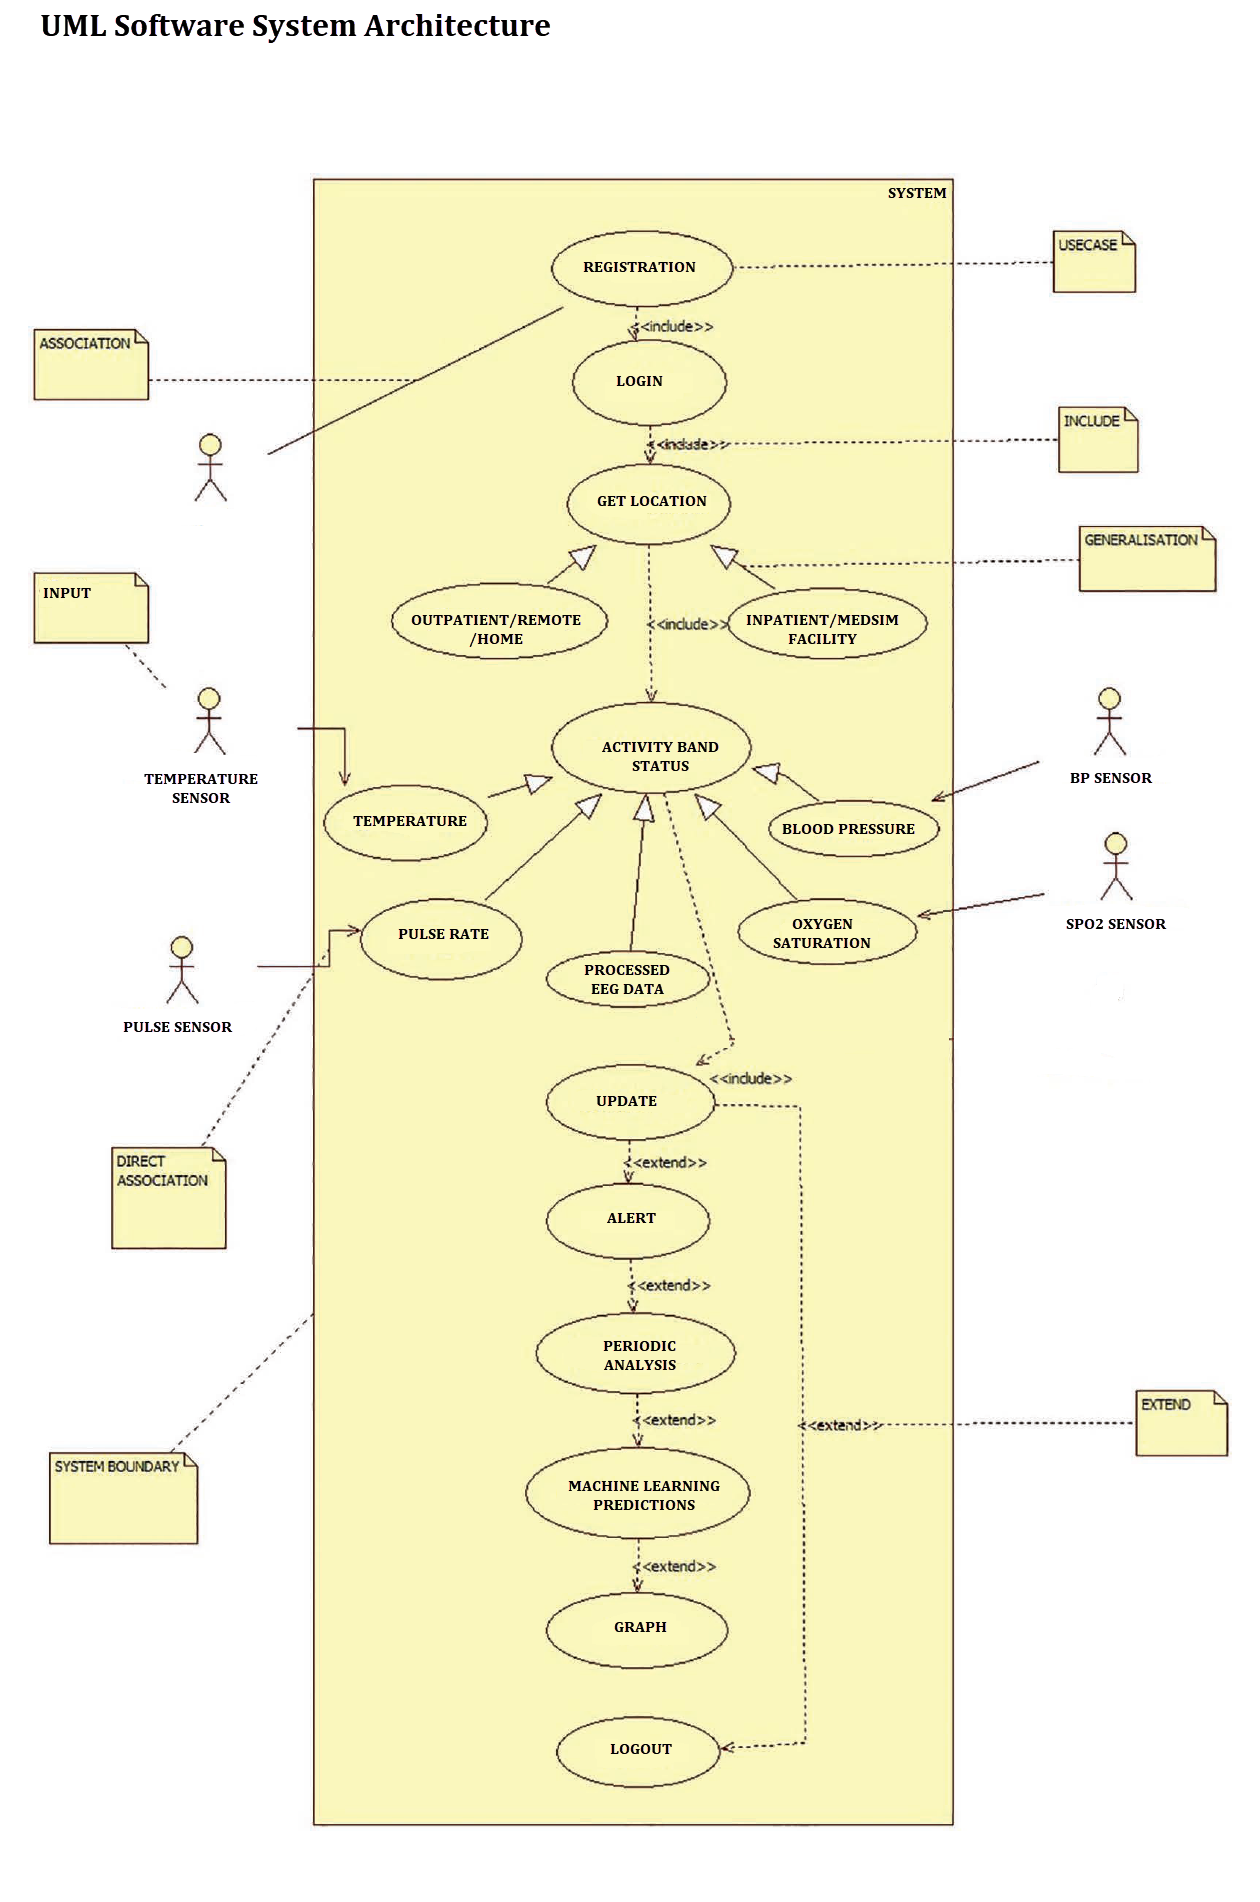
Sketching a UML usecase diagram ( see fig 4)
The construction phase involves a set of activities namely coding , testing, and feedback. This phase usually involves alpha testing i.e testing software at a developer site.
The transition phase involves the following
Beta testing i.e testing a software at the client site without the support of developers
Deployement in production
Fne tuning, done based on the feedback from the clientside.
UML Usecase Diagram
Outputs
Outputs: Generate data to support further development of neural connectivity capabilities, aggregate matrix made up of the correlation coefficient values, sensor correlation with spatial resolution matrix, strength of synchronization, Measures of inter-band difference.
Brain region synchronization plots with 2d & 3d visualizations
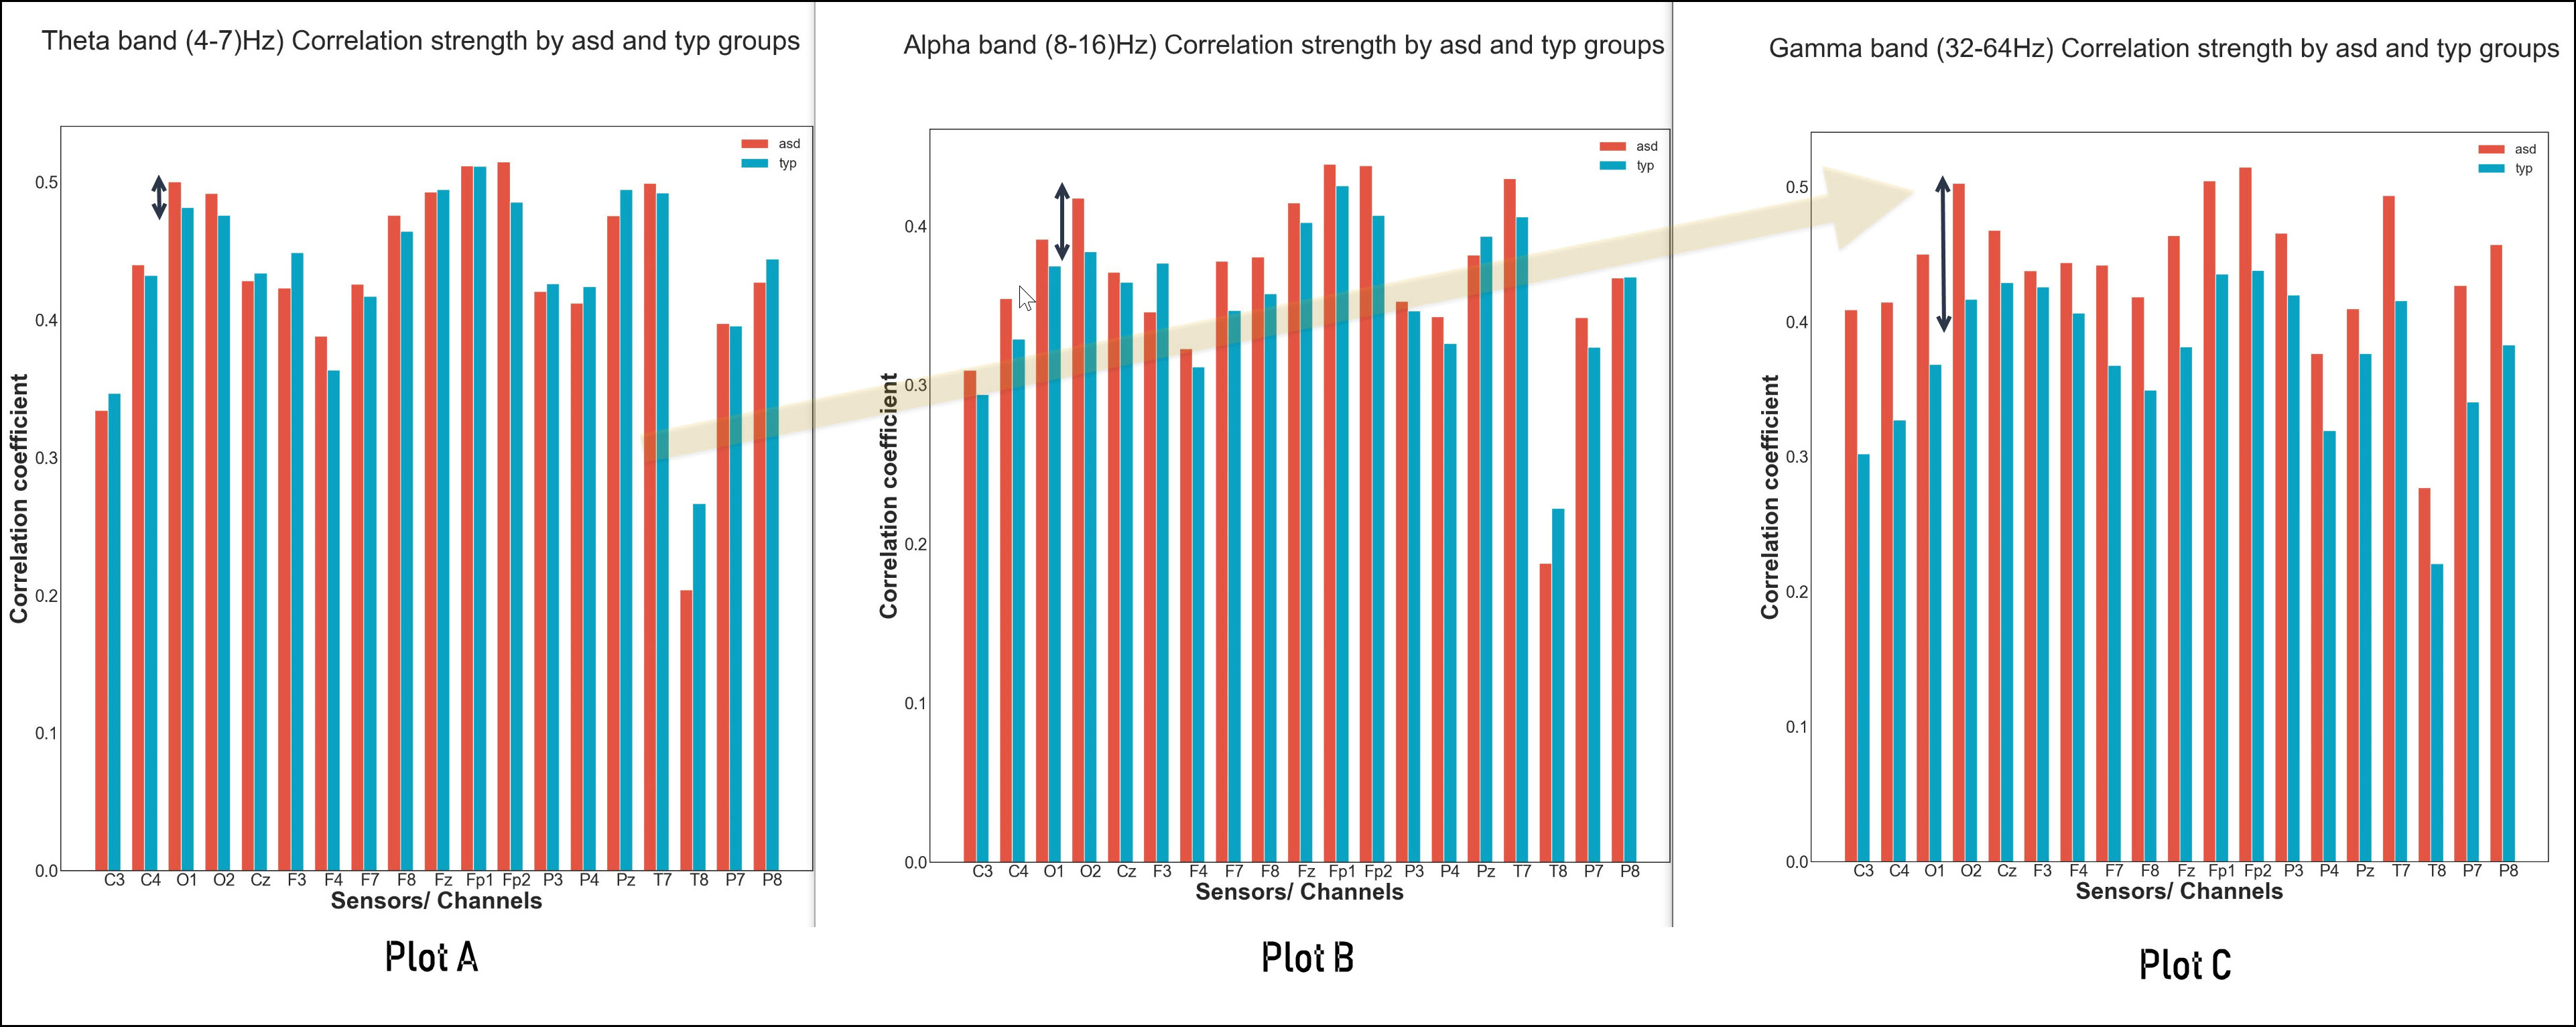
Theta (4-8 hz) Circuits involving signals transmitted in several cognitive functions including memory and cognitive control.
Alpha (8-12 hz). Functions related to wakeful state and resting quietly.
Gamma (32 - 60 hz). Large scale brain network activity & cognitive phenomenon such as working memory, attention and perception grouping. Mood and cognitive disorder prone region.
Machine learning classification analysis report.
Interband Correlation Strength
Synchronization strength: Synchronization strength was observed as a function of the intergroup difference d1, d2 and d3 from the mean aggregate sensor pair correlation coefficient. Correlation strength increases proportionately as the frequency magnitude in the ASD subjects increases. (d3 > d2 & d2 > d1). The highest strength was observed for the Gamma band within the 32-64Hz spectrum and the ASD brain regions experienced stronger synchronization compared to the region in the typical subject.
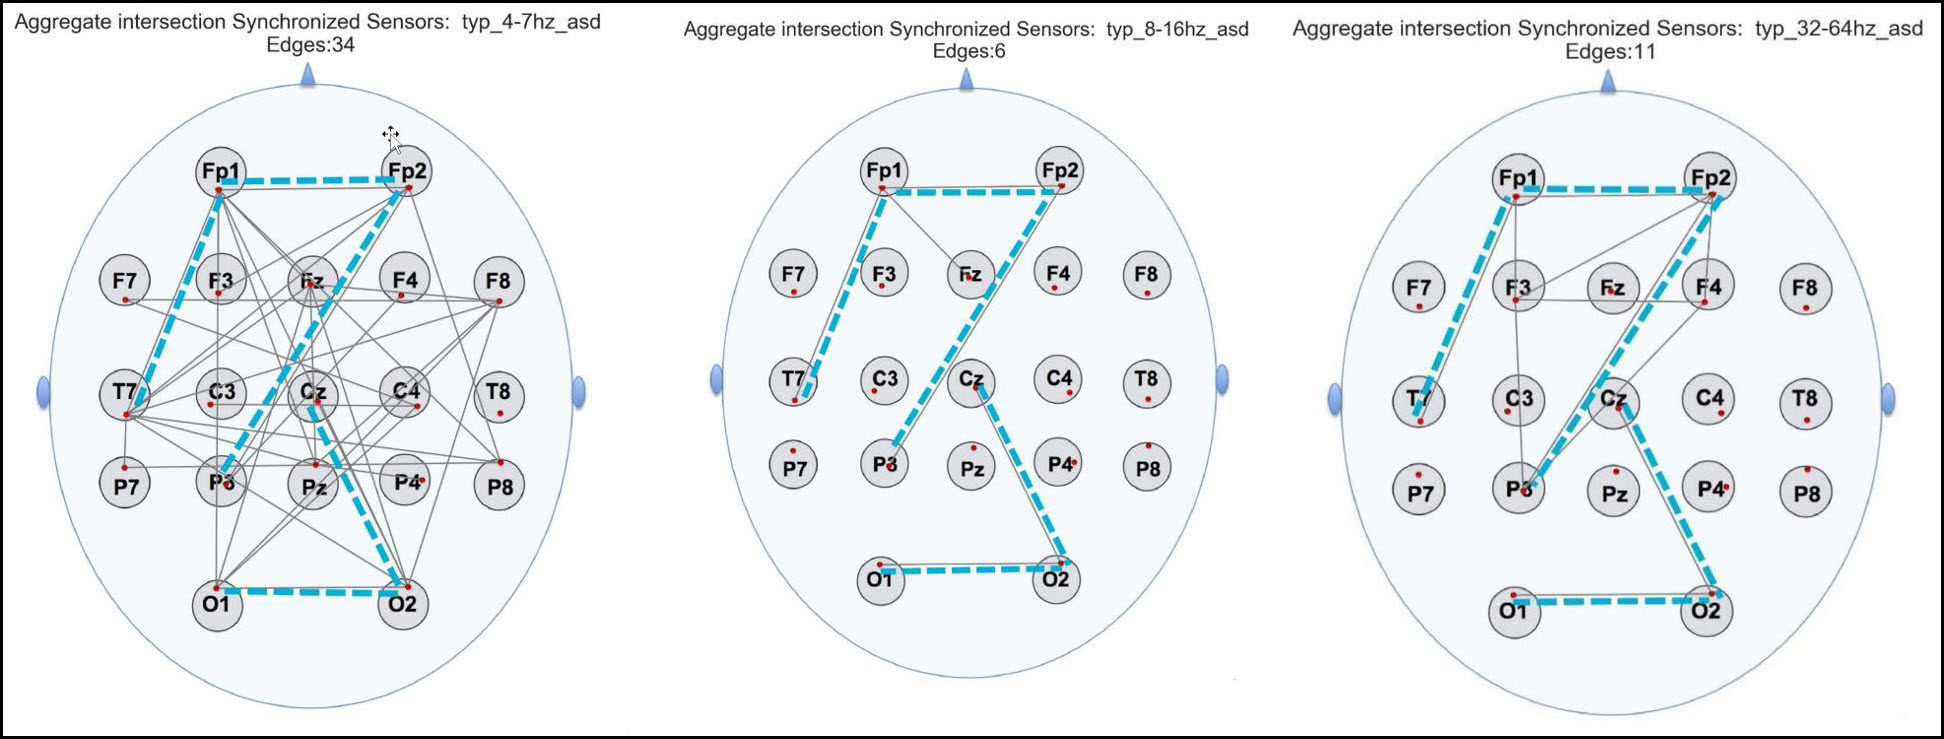
Intergroup common network circuit in the theta, alpha, gamma band
Consistent path: Intersection of the ASD and TYP group network graph for all frequency band showed that these paths highlighted have a consistent pattern within the groups of interest in this study. Prominent of all the consistent paths include T7 – Fp1 – Fp2 -P3 & Cz – O2 – O1. During this analysis, these observed pattern suggest the possible presence of aspects of the default mode network.
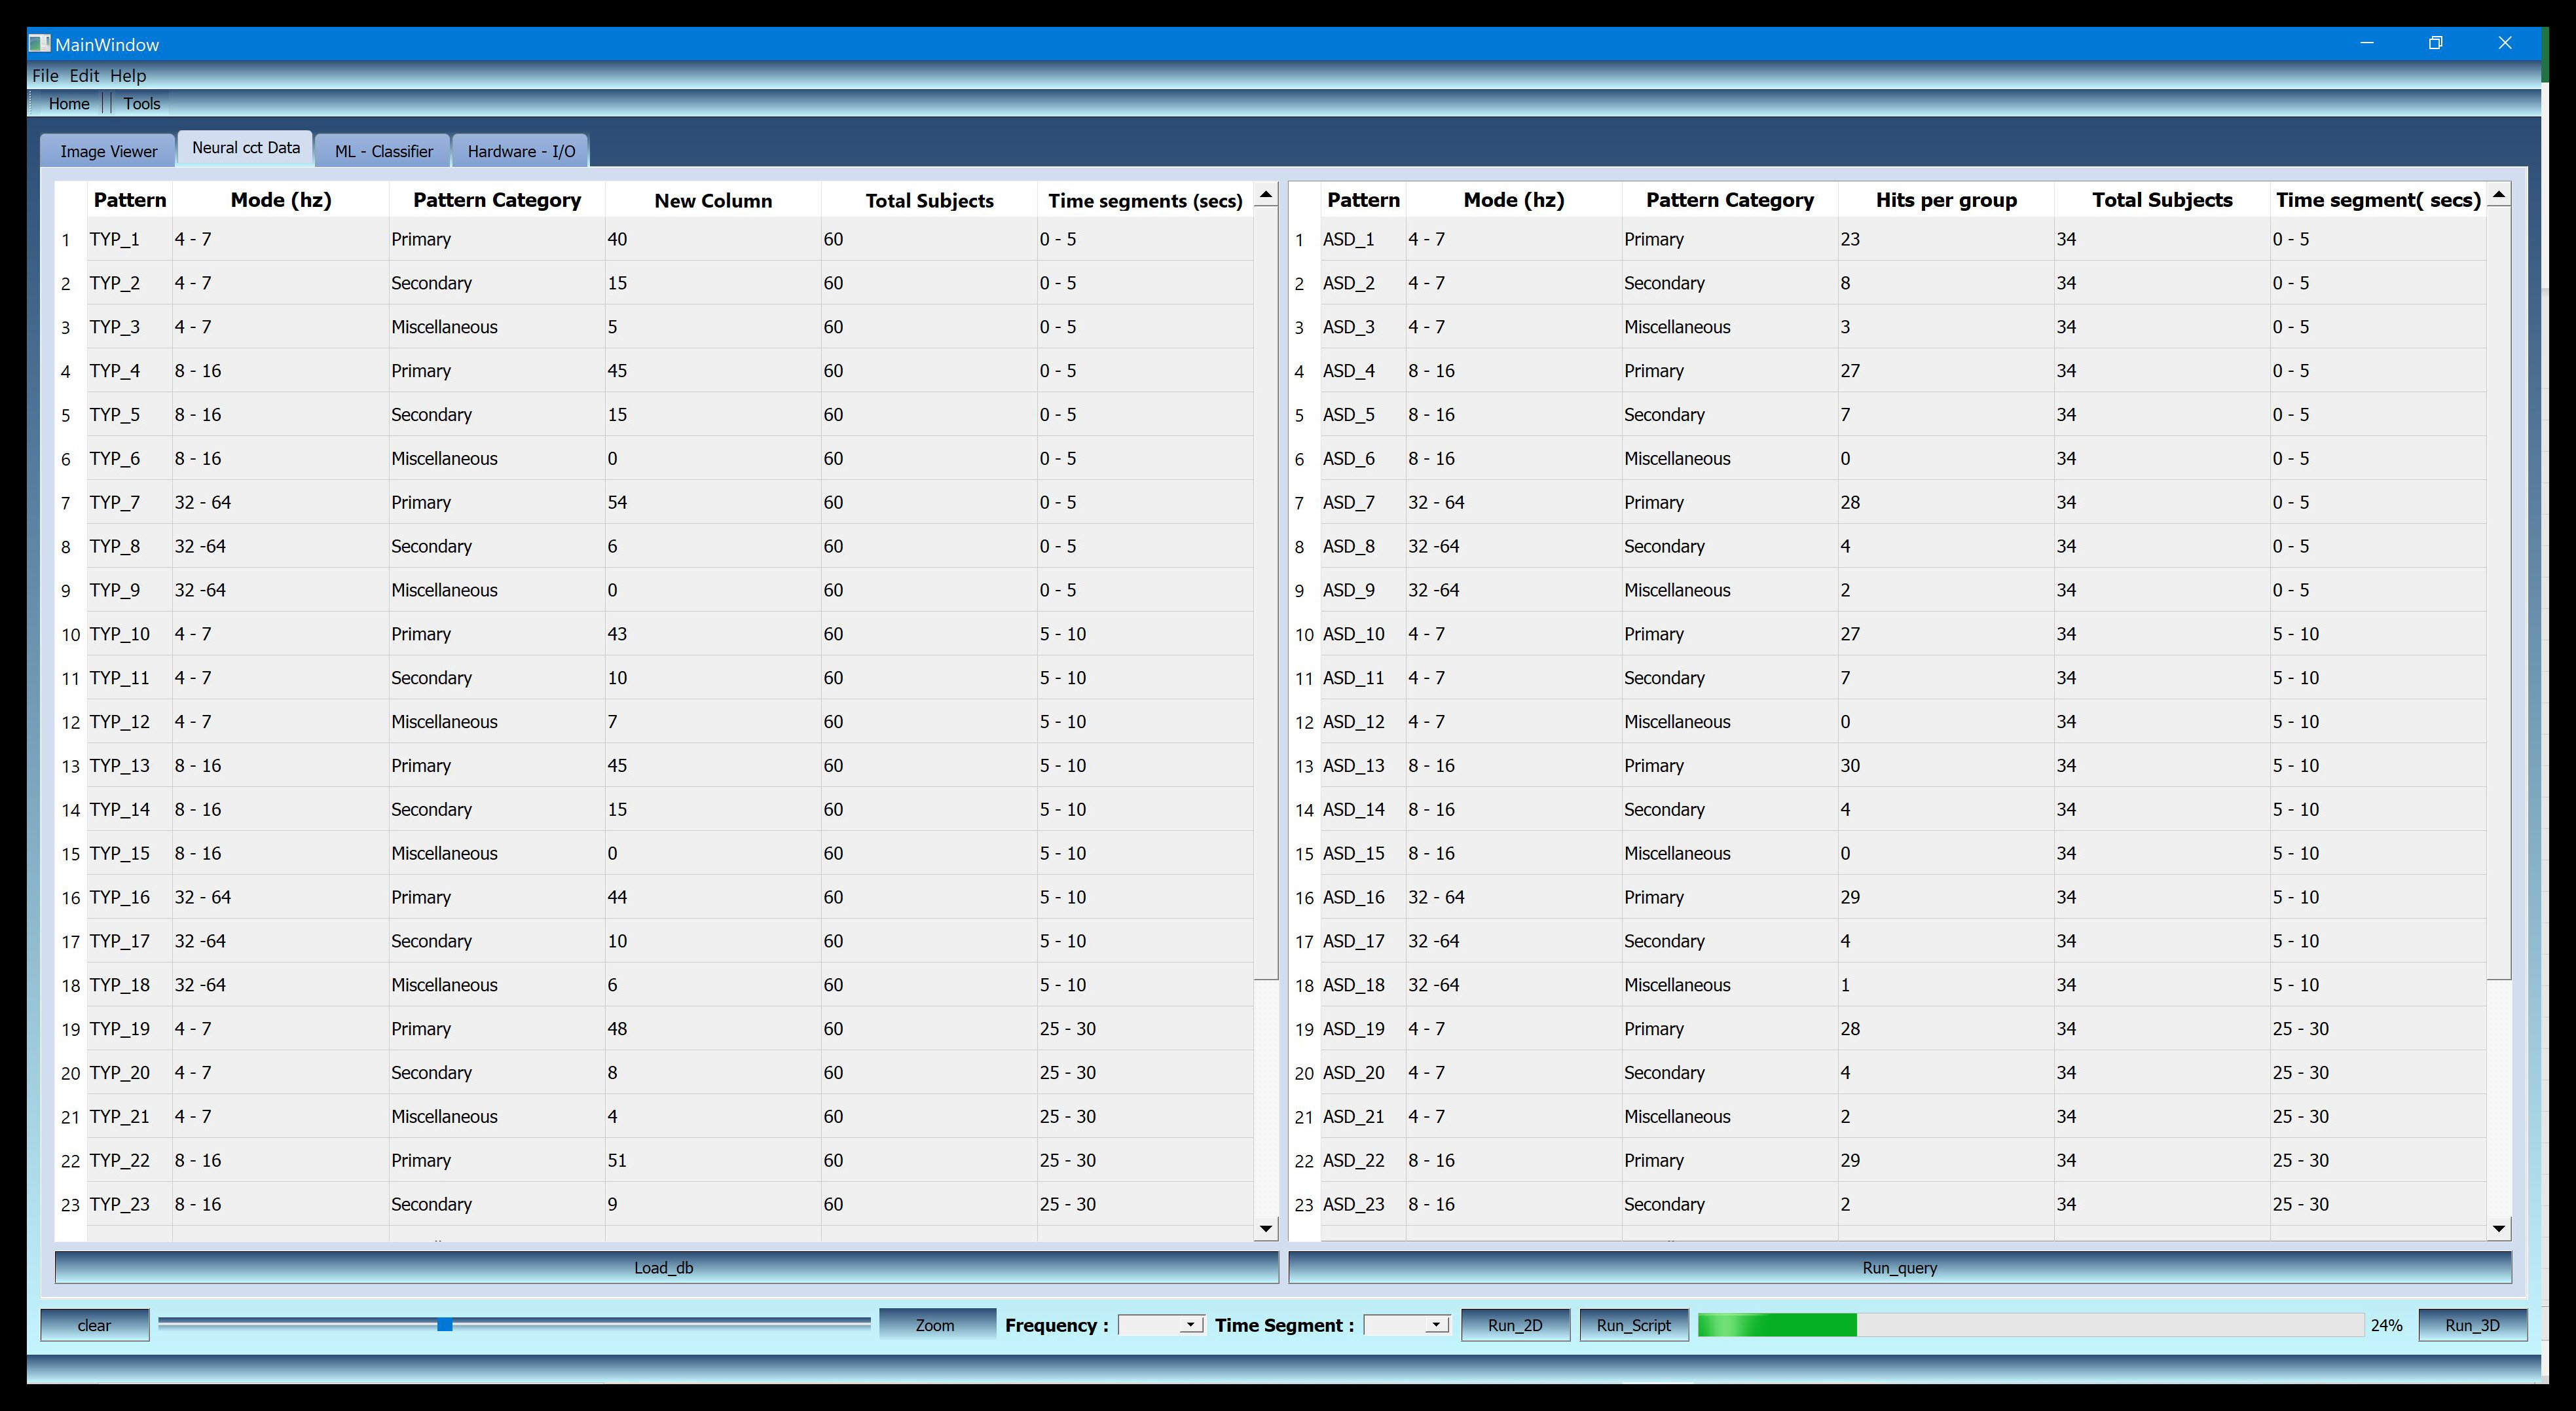
Second tab of the APP`s Graphical User Interface with Neural circuit data
The 2nd Tab displays curated data querried from postgres tables based on the selected band as chosen on the Time segment widget. Each selected band also represents a mode of the patient.
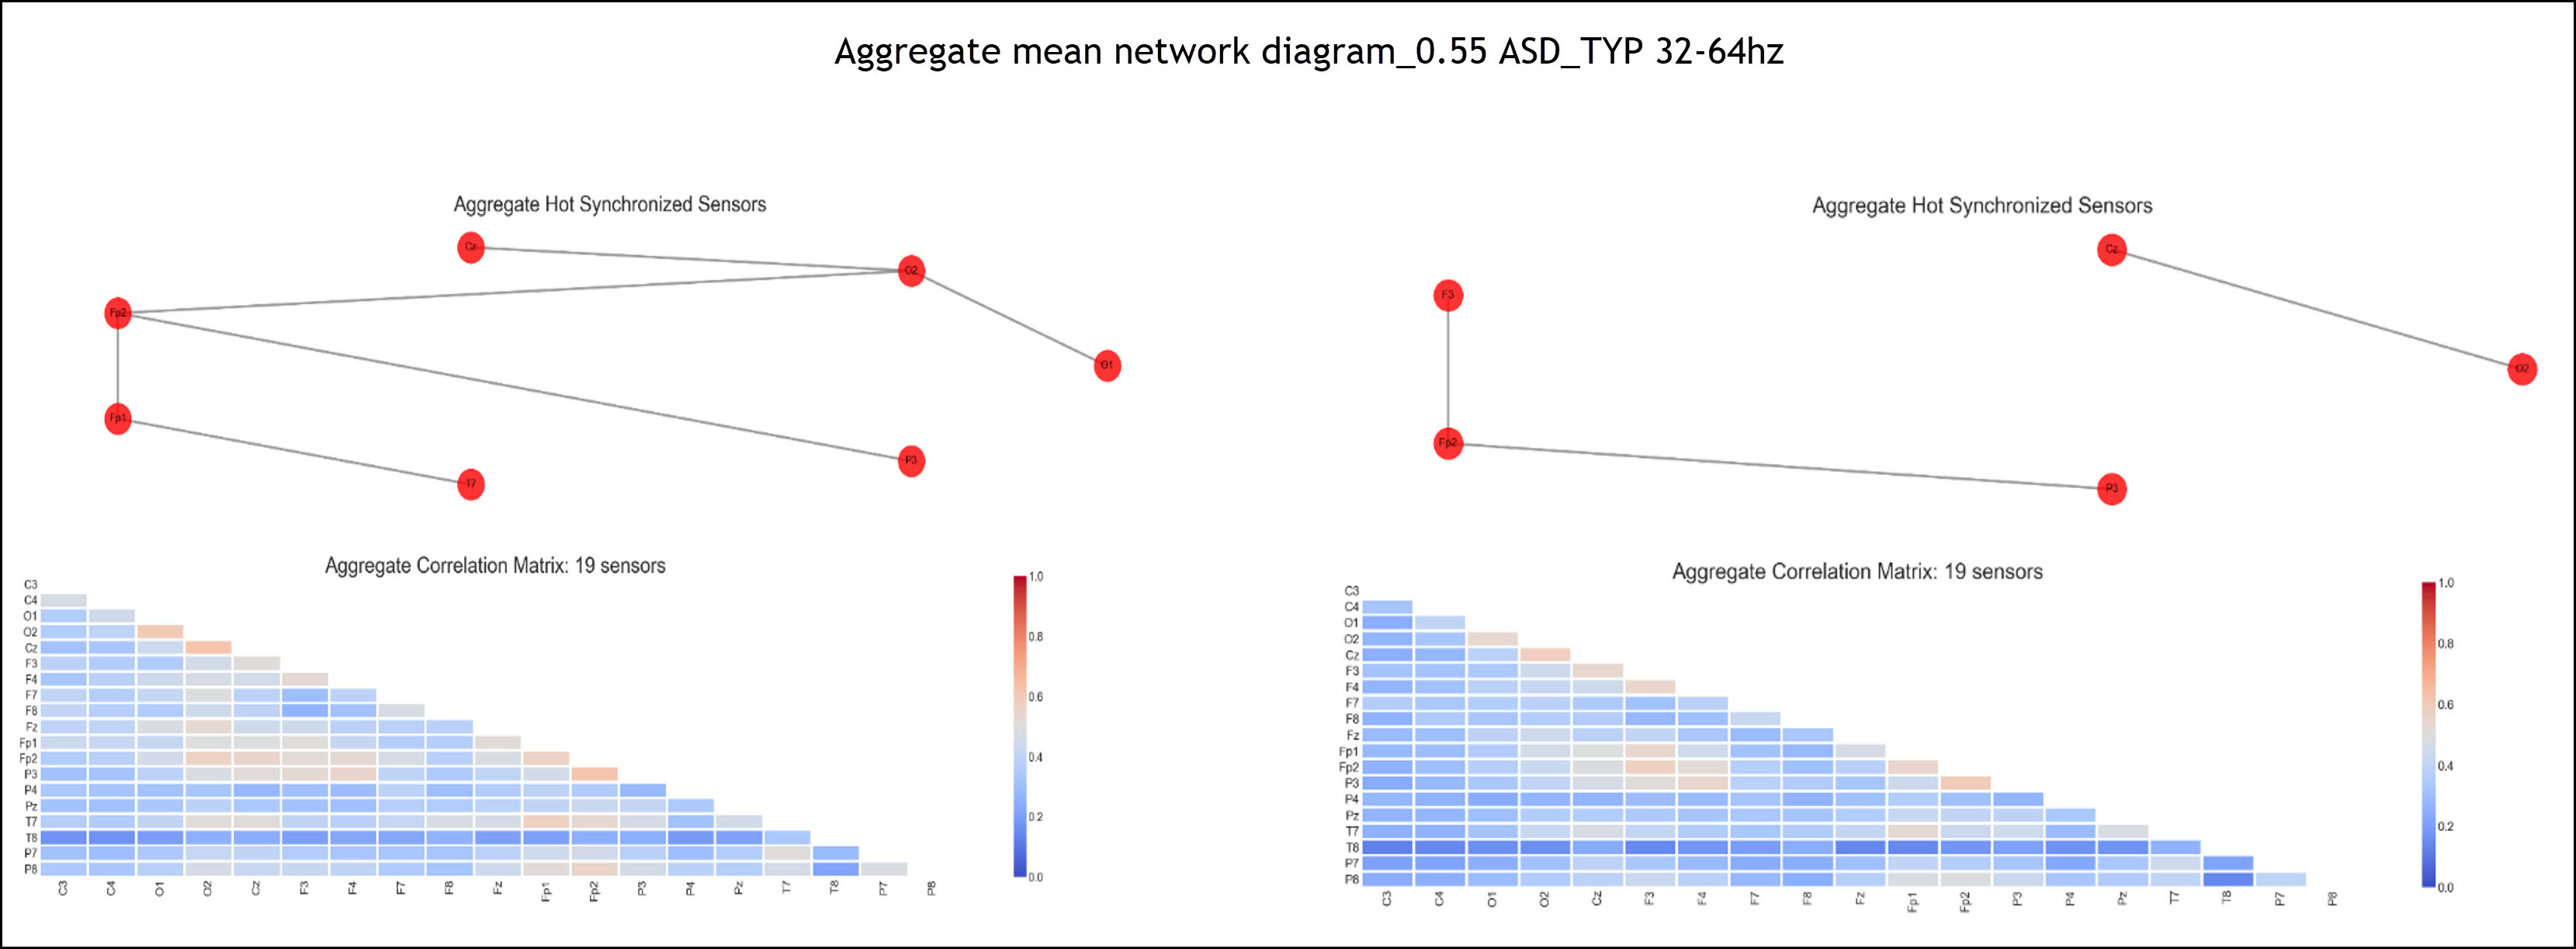
Aggregate mode network diagram ASD_TYP 32-64hz
Correlation matrix and hot correlated sensors. The video snippet bellow shows the front end GUI of the App in development mode. Current tabs include image viewer: Generate patterns in segments of the measurement period and visualize aggregate mode patterns for abnormal vs normal neural circuit. Data aggregator/viewer: Tabulates the extracted matrix and labelled pattern. In the current build, keeping all the variables constant 157/180 of ASD patients possess the pattern observed on the left image, while 140/150 of normal patient possess the observed pattern on the right. The third tab shows Machine Learning Classification report planned to apply random forest and classify the extracted patterns and the fourth tab is designed to perform hardware input/output functions. The third & fourth tab is still work in progress.